Archive for the ‘energy’ Category

Yes, global warming is man-made

Friday, November 27th, 2009

UPDATE # 3: The IPCC chair says there is no problem. “Peer review” will save us. Full speed ahead to Copenhagen.

No surprise there.

UPDATE # 2: More chicanery. The raw data was dumped years ago and there is no way to check their work. This is not science.

UPDATE: Little Green Footballs blogger Charles Johnson, who became famous over the Bush TANG story (He was the first to demonstrate the fact that the alleged 1972 memo was written on a computer with Times New Roman font), has gone off the deep end on the climate data manipulation story and is attacking all the stories about data manipulation and falsification as “lies.” Charles is an expert by virtue of the fact that he is a musician. He seems to have gotten obsessed with creationism and this has led to his downfall on these other issues.

From his link, a comment explains it all:

Thanks, Gareth – NZC”S”C revealed yet again to be idealogues and propagandists with little knowledge of either climate or science; mere shills for the fossil fuel industry who fund them through the Heartland Institute.

And we know who funds the alarmists.

There is another comment that makes a much more sensible point:

Sorry CJ, this time your avoiding some troubling facts. If you haven’t go look at the code (I know your skilled in this area and you will see how bad this PhD quality code is to real SW that can endanger people). For those of us who stood by you on Rathergate, while your credibility was attacked by folks who don’t know why you made sense, you should realize there are some of us just as insightful and trained to detect bad assumptions, questionable massaging, unfounded theories on global climate.

The fact is the raw data across the globe (even the CRU raw temps) don’t show runaway global warming. It’s not just the emails (which you have been cherry picking, avoiding the hard ones where people tell others to illegally destroy data). It’s the code with hard coded overwrites. It is the deletion of data that tells a contradictory story, of cutting off the picture when it looks bad.

Honestly, I thought much higher of you than this.

BTW, to disagree with global warming does not make you a Palinista or Right winger. They can be right for the wrong reasons. Just like loving you family doesn’t make you an evil right winger – something else they have in common with all of us.

Whatever your issues forget them and look at the code and the data objectively. And realize Jones, Mann et al were persecuting people with differing theories and opinions. They were the ones acting like right wing purists – not us independents who just happen to be able to detect hundreds of problems with the current theories and the methods they use to hide the full picture.

Look at the entire picture, no matter how uncomfortable

This is an example of the fact that, unlike most left wing blogs, Johnson is still posting critical comments. We’ll see how he responds.

Unfortunately, he responds like a left wing blog:

re: #35 AJStrata

And I thought much more highly of you too, before learning that you’re a hardcore climate change denier who’s not above distorting and misrepresenting facts.

Oh well. He was right about the Bush story. I don’t know where this stuff came from.

It is now becoming clear that global warming is man-made. The cause is not CO2 but something simpler and more easy to explain. It was caused by the manipulation of data for the purpose of creating a fraud. When bankers and stock brokers do it, they go to jail.

Kiwigraph1

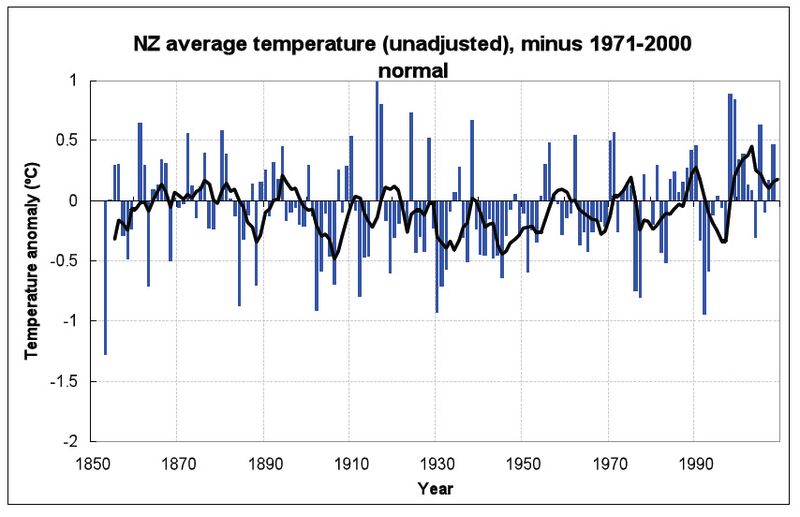
This is what the official New Zealand National Institute of Water and Atmospheric Research has posted as the unmistakable trend of temperature since 1853 in New Zealand.
Kiwigraph2

This is a graphic created from unaltered raw data, which is fortunately still available from their files. The raw data at the East Anglia CRU has been destroyed, making such a comparison impossible.

Straight away you can see there’s no slope—either up or down. The temperatures are remarkably constant way back to the 1850s. Of course, the temperature still varies from year to year, but the trend stays level—statistically insignificant at 0.06°C per century since 1850.
Putting these two graphs side by side, you can see huge differences. What is going on?
Why does NIWA’s graph show strong warming, but graphing their own raw data looks completely different? Their graph shows warming, but the actual temperature readings show none whatsoever!
Have the readings in the official NIWA graph been adjusted?
It is relatively easy to find out. We compared raw data for each station (from NIWA’s web site) with the adjusted official data, which we obtained from one of Dr Salinger’s colleagues.
Requests for this information from Dr Salinger himself over the years, by different scientists, have long gone unanswered, but now we might discover the truth.

At least the data was not destroyed as it has been at East Anglia.

What did we find? First, the station histories are unremarkable. There are no reasons for any large corrections. But we were astonished to find that strong adjustments have indeed been made.

About half the adjustments actually created a warming trend where none existed; the other half greatly exaggerated existing warming. All the adjustments increased or even created a warming trend, with only one (Dunedin) going the other way and slightly reducing the original trend.
The shocking truth is that the oldest readings have been cranked way down and later readings artificially lifted to give a false impression of warming, as documented below. There is nothing in the station histories to warrant these adjustments and to date Dr Salinger and NIWA have not revealed why they did this.

These people who committed this fraud (I agree that hoax is not the proper term as it is too benign) should be prosecuted. They were paid government funds to do research and they falsified it. Why ? That is still to be determined but there are several possibilities. They could have convinced themselves that the natural slight warming trend after the end of the Little Ice Age was more serious. They could be ideologically opposed to modern life and especially capitalism. Maybe they just thought that more funds for research would be forthcoming if a crisis was created.

Climate change is in hot water now.

Friday, November 20th, 2009

UPDATE # 6: An elegant analysis from Rand Simberg who is an engineer.

UPDATE # 5: Another excellent analysis of the whole data dump and what it means. I especially like this summary:

The emails are in fact uncharacteristic of typical scientific email correspondence because they include:
(1) requests to delete data to avoid Freedom of Information Act requests;
(2) requests to delete all copy of emails for secrecy;
(3) colluding with other supposedly anonymous reviewers in order to reject particular scientific papers;
(4) attempting to ban critics from any peer-reviewed journals by, for example, successfully getting them fired from editorial positions;
(5) participation and publication of patently absurd graphs and theories, e.g. using selected tree rings as some kind global temperature proxy and using that to justify restructuring the global economy; or publishing theories and demanding action based on data that they would not release; and finally
(6) collusion in the public animosity and hysteria directed against individuals and institutions who felt there was insufficient evidence of global warming and its causes to justify remedial action (e.g., calling skeptics “deniers” or “akin to war criminals” or comparing them to flat-earth advocates).
All these taken together are clear evidence that the actions of the scientists involved are well outside the mainstream of scientific behavior.

UPDATE # 5: More analysis of e-mails here. This is not good for Al Gore.

UPDATE #4: Some analysis of the data so far from Powerline.
As far as I can tell from the email archive, Briffa never did respond to the plant scientist. Jones’s email warning Briffa to be “very wary about responding to this person now having seen what McIntyre has put up” was written just three weeks ago. It, along with the rest of the email archive, makes an utter mockery of the alarmists’ claim that the science of global warming is settled in their favor.

On the contrary, the conclusion an observer is likely to draw from the CRU archive is that the climate alarmists are making up the science as they go along and are fitting facts to reach a predetermined conclusion rather than objectively seeking after truth. What they are doing is politics, not science. When I was in law school, this story was told about accountants: A CEO is going to hire a new accountant and summons a series of candidates. He asks each applicant, “What is two plus two?” The first two candidates answer, “Four.” They don’t get the job. The third responds, “What do you want it to be?” He gets hired. The climate alarmists’ attitude toward data appears to me much the same as that fictional accountant’s attitude toward arithmetic.

This is far from over.

UPDATE #3: more and more on the fraud which will be hard for failed divinity student Gore to refute. This is really going to be a fiasco.

UPDATE #2: Even the NY Times is covering the story which means the story is really big ! Some are even talking about a hoax!

If you own any shares in alternative energy companies I should start dumping them NOW. The conspiracy behind the Anthropogenic Global Warming myth (aka AGW; aka ManBearPig) has been suddenly, brutally and quite deliciously exposed after a hacker broke into the computers at the University of East Anglia’s Climate Research Unit (aka Hadley CRU) and released 61 megabites of confidential files onto the internet. (Hat tip: Watts Up With That)
When you read some of those files – including 1079 emails and 72 documents – you realise just why the boffins at Hadley CRU might have preferred to keep them confidential. As Andrew Bolt puts it, this scandal could well be “the greatest in modern science”. These alleged emails – supposedly exchanged by some of the most prominent scientists pushing AGW theory – suggest:
Conspiracy, collusion in exaggerating warming data, possibly illegal destruction of embarrassing information, organised resistance to disclosure, manipulation of data, private admissions of flaws in their public claims and much more.

Wow !

UPDATE: The BBC is after the hacker, intent on stamping out this sort of crime, no doubt.

A hacker seems to have gotten into the UK climate research unit database, including e-mails, and spread the files all over the internet. This will create a sensation in climate circles and some of the blogs have volume too high to keep up with. The news is already all over the world, at least the world of climate interest.

The director of Britain’s leading Climate Research Unit, Phil Jones, has told Investigate magazine’s TGIF Edition tonight …”It was a hacker. We were aware of this about three or four days ago that someone had hacked into our system and taken and copied loads of data files and emails.”…

TGIF asked Jones about the controversial email discussing “hiding the decline”, and Jones explained what he was trying to say….

The full e-mail is now posted:

From: Phil Jones
To: ray bradley ,mann@XXXX, mhughes@XXXX
Subject: Diagram for WMO Statement
Date: Tue, 16 Nov 1999 13:31:15 +0000
Cc: k.briffa@XXX.osborn@XXXX

Dear Ray, Mike and Malcolm,

Once Tim’s got a diagram here we’ll send that either later today or first thing tomorrow.

I’ve just completed Mike’s Nature trick of adding in the real temps to each series for the last 20 years (ie from 1981 onwards) amd from 1961 for Keith’s to hide the decline. Mike’s series got the annual land and marine values while the other two got April-Sept for NH land N of 20N. The latter two are real for 1999, while the estimate for 1999 for NH combined is +0.44C wrt 61-90. The Global estimate for 1999 with data through Oct is +0.35C cf. 0.57 for 1998.

Thanks for the comments, Ray.

Cheers
Phil

Prof. Phil Jones
Climatic Research Unit Telephone XXXX
School of Environmental Sciences Fax XXXX
University of East Anglia
Norwich

Whoooops !!!

It may be an innocent explanation is coming but this is the most aggressive source for global warming agitation. In fact, a jury has acquitted Greenpeace activists in Britain for damaging a power plant in the interest of reducing CO2 emissions. I expect the hacker, if he is caught, might not be treated as generously.

From: Kevin Trenberth
To: Michael Mann
Subject: Re: BBC U-turn on climate
Date: Mon, 12 Oct 2009 08:57:37 -0600
Cc: Stephen H Schneider , Myles Allen , peter stott , “Philip D. Jones” , Benjamin Santer , Tom Wigley , Thomas R Karl , Gavin Schmidt , James Hansen , Michael Oppenheimer

Hi all

Well I have my own article on where the heck is global warming ? We are asking that here in Boulder where we have broken records the past two days for the coldest days on record. We had 4 inches of snow. The high the last 2 days was below 30F and the normal is 69F, and it smashed the previous records for these days by 10F. The low was about 18F and also a record low, well below the previous record low.

This is January weather (see the Rockies baseball playoff game was canceled on saturday and then played last night in below freezing weather).
Trenberth, K. E., 2009: An imperative for climate change planning: tracking Earth’s global energy. Current Opinion in Environmental Sustainability, 1, 19-27, doi:10.1016/j.cosust.2009.06.001. [1][PDF] (A PDF of the published version can be obtained from the author.)
***

The fact is that we can’t account for the lack of warming at the moment and it is a travesty that we can’t. The CERES data published in the August BAMS 09 supplement on 2008 shows there should be even more warming: but the data are surely wrong. Our observing system is inadequate.***

Is it a conspiracy ? Some people think so. Well, this should get the pot boiling.

Global Warming is Dead

Monday, September 28th, 2009

New data has now become available that shockingly discredits the Mann “Hockey Stick” graphic used by Al Gore and others in the hysterical climate camp.

rcs_chronologies1

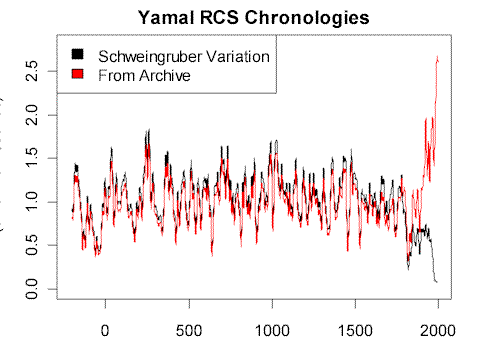
The next graphic compares the RCS chronologies from the two slightly different data sets: red – the RCS chronology calculated from the CRU archive (with the 12 picked cores); black – the RCS chronology calculated using the Schweingruber Yamal sample of living trees instead of the 12 picked trees used in the CRU archive. The difference is breathtaking.

The conclusion ?

This comparison to CRU archive data illustrates the most extreme example of scientific cherry-picking ever seen. As Steve writes in comments at CA:

Also keep in mind the implausibly small size of the current portion of the Yamal archive. It would be one thing if they had only sampled 10 trees and this is what they got. But they selected 10 trees out of a larger population. Because the selection yields such different results from a nearby population sample, there is a compelling prima facie argument that they’ve made biased picks. This is rebuttable. I would welcome hearing the argument on the other side. I’ve notified one dendro of the issue and requested him to assist in the interpretation of the new data (but am not very hopeful that he will speak up.)

See the complete report on this new development in the sordid story of tree ring proxies used for climate interpretation at Climate Audit. And while you are there, please give Steve a hit on the tip jar. With this revelation, he’s earned it.

What this means is that data from Russian tree rings has been cherry picked to yield a conclusion that the earth is warming and this is the hottest period in measurable records.

The volume at Climate Audit is so huge that the server is down. This is the global warming equivalent of a pimp and prostitute asking ACORN to help them set up an underage brothel.

UPDATE: More on this story,

While widely published in such prestigious publications as Science, Briffa has consistently refused to release the raw data on which his studies have been based. That alone should have been enough to disqualify him, as that is about as serious a breach of the scientific method as you can commit. But, perhaps because his studies undergirded the received wisdom regarding climate change, he got away with it. Until he published a paper in a publication of the Royal Society. The society has a policy:

As a condition of acceptance authors agree to honour any reasonable request by other researchers for materials, methods, or data necessary to verify the conclusion of the article… Supplementary data up to 10 Mb is placed on the Society’s website free of charge and is publicly accessible. Large datasets must be deposited in a recognised public domain database by the author prior to submission. The accession number should be provided for inclusion in the published article.

Steve McIntyre, a statistician and noted climate-change skeptic who has been repeatedly denied access to the data by Briffa for 10 years, wrote the Royal Society, which was embarrassed that this requirement had not been enforced. Briffa was eventually forced to comply (the details of McIntyre’s pursuit of the data he should have been given freely can be found in narrative form here). It appears (and I am no statistician, let alone a dendrochronologist) that the data was seriously cherry-picked to produce a desired result. When a larger and more logical data set is used, the hockey stick disappears (scroll down to see the chart). The late 20th century does not look any different from earlier times.

More yet here.

“1. I don’t believe this data plays into the “it’s worse than we thought” meme. This data is the basis of the hockey stick graphs that assert recent temperature changes are unnatural and AGW is blasting the graph above anything seen in human history.
2. The temperature history of the past thousand years or so is 2000 samples. The 12 trees are the basis of the late 20th century part of that history – the blade of the hockey stick.
3. Trees from the far north are used because their growth is assumed to be primarily limited by temperature. This should make them better treemometers than ones further south which have plentiful sunlight, a long growing season, and may be limited more severely by water availability, nutrients, or being blocked by neighboring trees. Still, they are only valid as treemometers if most of the population shows the same pattern. Once it is shown that the majority of the trees in that area don’t show the same 20th century pattern…
4. McIntyre has repeatedly focused on how the proxies represent current warming vis-a-vis the medieval warming period that some AGW ultraorthodox refuse to admit existed. He is not claiming that this work disproves AGW. I think he is claiming that with proper proxies the MWP can be seen to have been hotter than today.

5. Schweingruber is a colleague of Britta who took samples from the same type of tree in an area within the range of the Yamal samples. The addition of these samples gave a more robust result than the 12 samples Britta used.

6. Neither Britta nor Schweingruber archived samples they collected but decided not to use, but the assertion was made that one expedition would have collected far more samples than were kept. This leads some people to infer that cores were selected based on their conformity to the hockey stick theory.

This is really enough but it won’t be.

Green shoots of hope ?

Monday, September 14th, 2009

There has been some talk of an impending recovery, maybe in time for the 2010 election. Don’t count on it.
ghost fleet

Those are 500 ships, mostly tankers and container ships, that are anchored near Singapore. They are about 12 % of the commercial fleet and there are estimates that soon it may reach 25%.

Here, on a sleepy stretch of shoreline at the far end of Asia, is surely the biggest and most secretive gathering of ships in maritime history. Their numbers are equivalent to the entire British and American navies combined; their tonnage is far greater. Container ships, bulk carriers, oil tankers – all should be steaming fully laden between China, Britain, Europe and the US, stocking camera shops, PC Worlds and Argos depots ahead of the retail pandemonium of 2009. But their water has been stolen.
They are a powerful and tangible representation of the hurricanes that have been wrought by the global economic crisis; an iron curtain drawn along the coastline of the southern edge of Malaysia’s rural Johor state, 50 miles east of Singapore harbour.

Obama’s new trade war with China will not help.

Some experts believe the ratio of container ships sitting idle could rise to 25 per cent within two years in an extraordinary downturn that shipping giant Maersk has called a ‘crisis of historic dimensions’. Last month the company reported its first half-year loss in its 105-year history.
Martin Stopford, managing director of Clarksons, London’s biggest ship broker, says container shipping has been hit particularly hard: ‘In 2006 and 2007 trade was growing at 11 per cent. In 2008 it slowed down by 4.7 per cent. This year we think it might go down by as much as eight per cent. If it costs £7,000 a day to put the ship to sea and if you only get £6,000 a day, than you have got a decision to make.
‘Yet at the same time, the supply of container ships is growing. This year, supply could be up by around 12 per cent and demand is down by eight per cent. Twenty per cent spare is a lot of spare of anything – and it’s come out of nowhere.’
These empty ships should be carrying Christmas over to the West. All retailers will have already ordered their stock for the festive season long ago. With more than 92 per cent of all goods coming into the UK by sea, much of it should be on its way here if it is going to make it to the shelves before Christmas.

I recently posted my opinion that the stock market rally may be over. I haven’t changed my mind. The assault on capitalism by this administration will be a disaster.

The rally may be over

Tuesday, September 8th, 2009

I have thought all along that this was a bear market rally since March. Now, there are signs that insiders are selling so they think it is over. Selling is 30 times buying by insiders and sophisticated investors. Why ? Look at the coming consideration of Cap and Trade. Why would anyone invest in the USA ? Maybe if it fails, the market will rally.

Obama has no concept of economics and I doubt he has many advisors who do. There just doesn’t seem to be a Robert Rubin who could lecture Bill Clinton. The Democrats even admit that Cap and Trade will cost jobs.

House Speaker Nancy Pelosi of California urged her colleagues to vote in favor of the cap and trade bill, saying the measure was about four things: “jobs, jobs, jobs, and jobs.”

She was right—the House-passed version of cap and trade is all about jobs: jobs lost, jobs never created, jobs sent overseas, and, unbelievably, jobs people will be paid for doing long after they cease to exist.

According to Friday’s Washington Times, the legislation includes language that provides, should it become law, that people who lose their jobs because of it “could get a weekly paycheck for up to three years, subsidies to find new work and other generous benefits—courtesy of Uncle Sam.”

How generous are these benefits? Well, according to the Times, “Adversely affected employees in oil, coal and other fossil-fuel sector jobs would qualify for a weekly check worth 70 percent of their current salary for up to three years. In addition, they would get $1,500 for job-search assistance and $1,500 for moving expenses from the bill’s ‘climate change worker adjustment assistance’ program, which is expected to cost $4.2 billion from 2011 to 2019.”

Instead of being a the source of millions of new jobs of “green jobs”—as House Democrats are fond of saying over and over again—the provision is a hidden admission that their effort is a job killer, not just a massive new tax on energy.

That should certainly make the stock market sit up and take notice.

Health care Obama style

Thursday, August 6th, 2009

I monitor some left wing blogs in order to keep up with the current meme that is animating the left. At one time, it was an attack on George Bush’s service in the Texas Air National Guard. A left-wing blogger named Kevin Drum did a far more thorough study of this story than CBS did, for example, and concluded there was no real story there. I developed considerable respect for Kevin from this incident and have been disappointed to see how few other examples I can find of objective analysis by the left. The current health care debate is one which pits a basic pillar of “progressive thinking”, single payer health care, against the realities of such instances as exist today.

I have been a bit puzzled to see an organization like AARP join Obama on the “reform” bandwagon, such as it is. They are supposed to represent members who are eligible for or members of Medicare and one thing we can all be certain of is the prospect of rationing of care for the elderly in any Obama sponsored plan. It seems that some AARP members have figured this out. maybe the AARP staffers who marched out of that meeting can report the violent oldsters to flag@whitehouse.gov. Here I link to a useful guide for those who wish to identify the evil right wing mob members :).

Anyway, I have run across a good analogy of what this supposed reform is all about. It’s about a new Nomenklatura. That’s the Chicago Way.

It is important that people realize that these government institutions will not be transparent nor will they be fair. A new, parallel system of privileges and favors will arise that will supplant our current system, which is largely cash based. As the government owns and controls more of society, it will be more important than ever to covet the friendship and favor of the Nomenklatura that will control access to queues and prestigious posts.

Luckily we have an entire body of knowledge of how the US will fare as government control increases – our study of the former Communist countries (which was largely done as a response to their military threat, since it was important to understand the “enemy” at the time). For example you can go here and see an interesting research paper related to the topic.

The occasional articles we see on corruption in the system are missing the point; the ENTIRE system will eventually be riven with corruption, because that is essentially how these sorts of socialistic enterprises all end up being run. It isn’t the spots on the dog, but the dog itself.

It is the essence of socialism that, once money is not the medium of exchange, another medium will be found. It is usually one that is available only to the insiders. It’s a bit like cutting $100 million from the trillion dollar budget, then ordering three new $65 million airplanes for Congress to fly around in.

UPDATE: It is now eight new airplanes. Do these people have any sense of where we are ?

Health care will never be more egalitarian than it is now.

California dreamin’

Thursday, July 23rd, 2009

California is in economic collapse. Without the nearby ocean, the state would have become Michigan by now. The politicians seem to think that the weather and the scenery will bring people no matter how badly the state is governed. They may be right but those people will be tourists and they will go home again to their jobs; the jobs that California doesn’t have. Why aren’t there jobs ?

This might explain it.

In 2006, Gov. Arnold Schwarzenegger and the California state legislature decided that each and every man, woman, and child in California should eliminate 4 tons of CO2 emissions by 2020. And so America’s first mandatory cap on greenhouse gasses, the Global Warming Solutions Act, became law. The state must now reduce its emissions to below 1990 levels, a 30 percent reduction from projected business-as-usual emissions, essentially cutting the allotment of carbon dioxide equivalent from 14 tons to 10 tons per person.

The fixation of California elites on global warming will kill the state’s economy soon. They, of course, don’t need jobs because most of them have trust funds, bloated pensions funded by the state or have income from sources outside the state (like the movie industry which has largely left the state). Are the politicians worried about jobs for the rest of their constituents ?

the California Air Resources Board predicts that increasing energy prices and implementing new regulations in California will improve the state’s economic outlook. A 2007 study by the Electric Power Research Institute begs to differ; the non-profit electricity industry think tank found that “the cost of meeting the stated 2020 emission reduction goal could range from $104 billion to $367 billion of reduced consumption (discounted present value through 2050).”

Last week, the California Small Business Roundtable issued their own report, charging proponents of the 2006 global warming mandate with wild optimism about its alleged beneficial economic effects. The report notes that California’s 700,000 small businesses comprise 99 percent of all employer firms, provide 52 percent of all jobs, and contribute 75 percent of gross state product. Using the California Air Resources Board’s own figures, the new report finds that the annual implementation costs would likely result in a loss of $182 billion in gross state output and 1.1 million fewer jobs. The business losses would occur in part because regulations would increase costs to consumers whose discretionary incomes would be reduced by about $3,800 per year as they paid more for housing, transportation, natural gas, electricity, and food.

Don’t worry, the state will keep its residents employed with “green jobs.”

In 2008, the California Air Resources Board issued a study reassuring Californians that they can make money hand over fist selling each other wind turbines and electric cars. Implementation of the cap “creates more jobs and saves individual households more money than if California stood by and pursued an unacceptable course of doing nothing at all to address our unbridled reliance on fossil fuels,” the study cheerfully declared.

This sounds remarkably like Obama. They have invented a perpetual motion machine. We’ll see if it works.

More Global Warming

Wednesday, July 15th, 2009

The problem with much of the global warming debate/hysteria has to do with the accuracy of the measurement of surface temperature, which is warmer than the space measurements. What is the problem ? One is what is called Urban Heat Islands, or UHI, and represents the confounding effect of large masses of concrete which absorb and retain heat from the sun. To avoid this factor, there has been emphasis on using rural locations for heat sensors. This introduces the problem of airports, often the site of “rural” temperature monitor stations. The black tarmac, used by airports for parking aircraft and even for landing strips in smaller airports, is even worse as a heat island than big cities. It absorbs heat from sunlight and retains it. How many rural monitoring stations in the US are NOT located at airports ?

Answer- None !

NOAA says that 345 of the stations it passes on to GISS are rural and presumably free of UHI influence. Fifteen of those stations are located in the US. However, only 201 of those rural stations are not located at an airport, and therefore presumably free of UHI effects (including tarmac heat sinks). In the US, only one of the fifteen stations is listed as both rural, and not located at an airport: Ely / Yelland in Nevada.

Doh!!! As noted above, that station is located at an airport – confirmed not just by Google Earth, but also by NOAA’s NCDC website as well! This means that all of the US temperatures – including those for Alaska and Hawaii – were collected from either an airport (the bulk of the data) or an urban location.

Why is this extra, extra important ?

Why are “dark” stations important? Recall that GISS uses dark stations to adjust for UHI in the urban stations. With only 128 dark stations available, none being in the US, it would seem this is an impossible task.

Fortunately, GISS adjustment rules allow old data to be used in adjusting new data. The older “non-reporting” rural weather stations continue to adjust reporting urban stations, even though the most recent two years of overlap is missing.

Once again, we are dependent on computer simulations while we decide whether to destroy the US economy to reduce global temperature by 0.09 degree F in 2050.

This is insanity but the AGW zealots may have finally overreached with Cap and Tax.

Obama and the “no-nukes” movement

Sunday, July 5th, 2009

The New York Times has discovered, conveniently too late for the election, a college essay by Barack Obama which may explain some of his beliefs that are otherwise inexplicable.

Realist or dreamer, Mr. Obama has an interest in global denuclearization that arises from what can best be described as a lost chapter of his life. Though he has written two memoirs, he has volunteered few details about his two years at Columbia.

“People assume he’s a novice,” said Michael L. Baron, who taught Mr. Obama in a Columbia seminar on international politics and American policy around the time he wrote the Sundial article. “He’s been thinking about these issues for a long time. It’s not like one of his advisers said, ‘Why don’t you throw this out?’ ”

In a paper for Dr. Baron, Mr. Obama analyzed how a president might go about negotiating nuclear arms reductions with the Russians — exactly what he is seeking to do this week.

The Cold War is over but Obama seems to be stuck in his youthful enthusiasm for a nuclear freeze. I don’t believe for a moment that he has any intention of stopping Iran in their quest for the bomb but he is determined to reduce our own nuclear capability.

Maybe this is behind his otherwise mysterious unwillingness to consider nuclear power, a source of electricity free from the alleged greenhouses gas production.

Smoot-Hawley II

Saturday, June 27th, 2009

UPDATE: California Congressman Tom McClintock cites an example in our state where a similar bill has deepened California’s recession.

When I was a child in school, we all learned that the Depression was made more severe, if not caused, by the Smoot-Hawley Tariff of 1930. Over a thousand economists signed a petition asking president Hoover not to sign it. Yesterday, the Waxman-Markey bill passed the House by a seven vote margin. It is as destructive of the US economy as the Smoot-Hawley Tariff was. Analysis is difficult because the bill has changed every day to accommodate lobbyists who offer support for a piece of the action. An analysis of its effect on the US economy is here by CATO Institute.

there is one policy nexus where congressional leaders are still doggedly determined to move the country left: energy and the environment. Speaker Pelosi will reportedly allow a vote on the controversial Waxman-Markey “cap-and-trade” legislation at the end of this week.

And it gets even better. Not content to tempt political fate by imposing huge carbon taxes on the American middle class, Democrats have added a provision which imposes stiff tariffs on our trading partners if they don’t adopt aggressive carbon restrictions of their own.

You heard correctly: progressives have authored a bill that earns the mortal enmity of domestic energy consumers and our most crucial trading partners at the same time. Economy-killing climate policies and a trade war — together at last!

The effect of the bill is a huge tax increase on the American public plus energy shortages for the rest of the century. The blather about “green jobs” is just that, blather.

And just for the sake of discussion, exactly how much global warming will be prevented by this assurance of future trade turmoil? Well, let’s use the federal government’s own model which — we are not making this up — is called MAGGIC (Model for the Assessment of Greenhouse-gas Induced Climate Change). It comes from the National Center for Atmospheric Research in Boulder, Colorado.

Let’s compare the effects of Waxman-Markey to the United Nations’ “business-as-usual” emissions scenario that’s in their big 2007 climate change compendium. If the U.S. only adopts Waxman-Markey, global warming would be reduced by a grand total of 0.2ºF by 2100. This is too small to even detect, because global temperatures bounce around by about this amount every year. For those who like to think more near-term, the amount of warming prevented by 2050 would be 0.07 of a degree.

According to the UN, without Waxman-Markey the warming from 1990 to 2050 would be 2.8ºF, and 5.3º by 2100. (Of course, observed warming since 1990 is running about 40 percent below the expected rate, largely because there hasn’t been any net warming since the very warm year of 1998.)

Now, let’s be completely unrealistic and assume that every nation that has “obligations” under the (failed) Kyoto Protocol cuts emissions as much as we do. Then the saved warming balloons all the way to 0.14ºF by 2050 and 0.4º by 2100, or 5 and 7 percent, respectively, of the “business-as-usual” total.

The legislation will wreck the US economy and start a trade war as Obama plans to raise tariffs on imports from countries that don’t adopt similar policies (China anyone ?). Fortunately, a wiser Congress can undo much of the damage as the Democrats have cleverly written the bill so none of the provisions, except the spending, take effect until after the 2012 elections.

The bill barely passed and would have been defeated except for eight Republicans. Their names are:

Bono Mack (CA)
Castle (DE)
Kirk (IL)
Lance (NJ)
LoBiondo (NJ)
McHugh (NY)
Reichert (WA)
Smith (NJ)

Without just 4 of these votes, the energy tax would have gone down and months of scheming by Henry Waxman and Speaker Pelosi would have been for naught. Two of them have hopes of a Senate run, I note. Twitter users are already calling them the #capntr8tors…

I think we can do without these people in the next Congress. If you want to understand just how ludicrous this act of Congress is, consider that there is no existing copy of the bill as passed. Not only didn’t they read it, it doesn’t exist. This is how banana republics are governed.